By George Café Research
University of Washington Cafeteria Research case study
Role
User Researcher
Timeline
2024
Team
Individual
Skills
Field observation, interview, quantitive research, qualitative research
Introduction
About
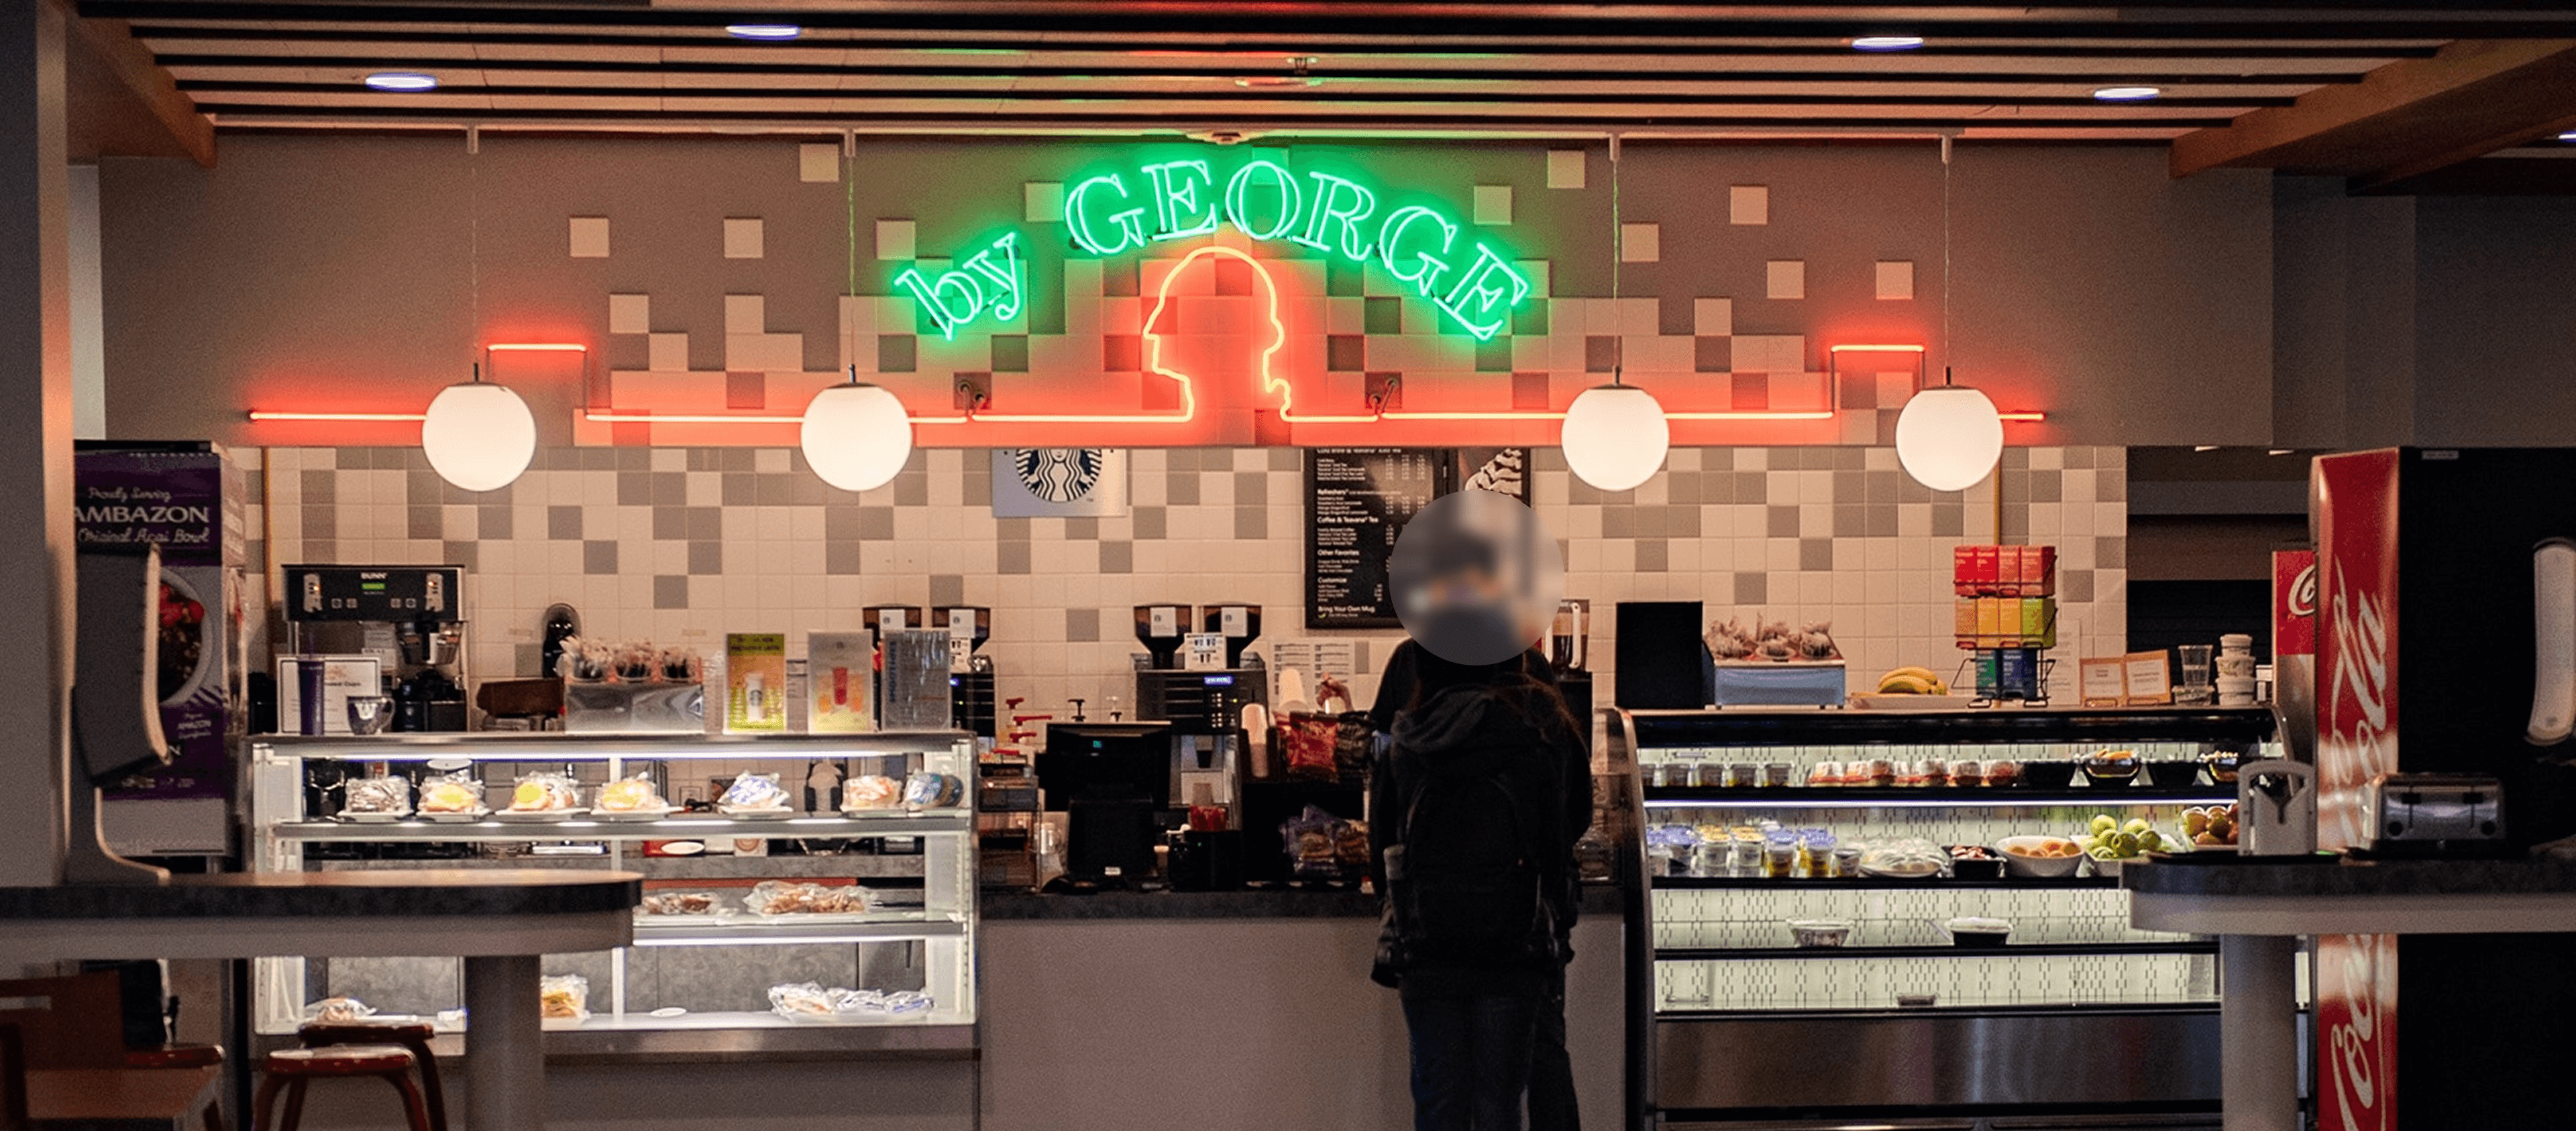
A campus café used in the narrow gap between classes.
By George Café is a University of Washington campus café used by students, faculty, and staff during the busiest part of the school day. Students chose By George because it was close to class and easy to access within a limited break. In that context, even moderate delays affected whether lunch could be finished, whether the next class was missed, and whether the experience felt reliable at all.
Time Pressure Context
Students arrived during a narrow break — often less than 45 minutes — that had to cover walking, ordering, waiting, eating, and returning to class.
Small delays carried outsized impact.
Research Objective
Understand friction before proposing solutions.
01
Where did friction appear?
Identifying specific service touchpoints that created confusion, delay, or extra effort during peak hours.
02
What made it tolerable?
Understanding why customers continued returning despite repeated friction and what role convenience played.
03
What made it costly?
Examining how time pressure amplified the impact of small service failures within a constrained lunch break.
Research Question
Focus Area
Where the service asked customers to do extra work.
Analysis focused on recurring patterns, not isolated moments. Single quotes were never treated as proof — cross-method alignment determined confidence.
Queue formation
& wait behavior
Technology use while
waiting
Pickup confusion &
order identification
Seating behavior
during short breaks
Menu readability &
decision-making
Methods
From raw observation to structured themes.
Analysis focused on recurring patterns, not isolated moments. Single quotes were never treated as proof — cross-method alignment determined confidence.
01 — Field Study
See it happen.
Captured real lunchtime behavior in context: queue formation, wait behavior, pickup flow, menu reading, and movement through the café.
4
sessions
3
hours observed
In-situ Research
Contextual Inquiry
02 — Interviews
Understand why.
Explained what observation alone could not show: tolerance for delay, reasons for repeat visits, and the perceived impact of friction.
3
sessions
35
avg. session
Semi-structured Interview
Thematic analysis
Qualitative Research
03 — Surveys
Check the scale.
Extended early qualitative patterns with broader input and identified which issues appeared most consistently across respondents.
27
participants
Quantitative Research
Process
From raw observation to structured themes.

The Convenience Trap
Traffic looked healthy.
Satisfaction told a different story.
Visit driver
Location or convenience
18 of 27 respondents. None of the daily visitors cited food quality as their primary reason.
Satisfaction gap out of 5.0
Location-driven avg. score
Convenience visitors scored 2.2 / 5. Food-quality visitors scored 3.6 — nearly double. The most frequent users were the least satisfied.
Alternatives
No viable options
All 3 interviewees mentioned there was no better option nearby during their break. Repeat visits were captive, not chosen.
The reason I go to eat at a café even if there are long lines is because the café is closest and in the middle of everything.
Participant 1
It's hard to say their food is bad, but it's not good. I just go there because it's close.
Participant 2
The café is literally right between my two classes. I have no choice but to come here.
Participant 3
Why this matters →
Foot traffic masked friction. Because students had no alternative, problems never produced the usual warning signs — declining visits or revenue. This made UX research the only way to surface what was going wrong. The findings that follow describe the specific friction points this convenience trap was hiding.
Focus Area
Each finding was built from three angles — not one.
Every issue below was identified through observation, explored through interviews, and tested through survey data. Confidence came from convergence across methods — not from any single sourc
Pickup was fast in theory, but unreliable in practice.
PICK UP FLOW
NOISE ENVIRONMENT
OBSERVED
Crowding at the pickup zone. Customers lingering, rechecking cups, stepping into others' paths. No clear staging area.
INTERVIEWED
All 3 participants cited missed name calls. One waited 5 extra minutes because their name wasn't announced clearly.
SURVEYED
Pickup area users rated efficiency 3.3 / 7 — the lowest of any zone. 4 of 27 named pickup as the most congested area.
"Sometimes it's hard to find mine if I miss the staff member's shout."
Participant 2
"I remember I had to wait an extra five minutes because my name wasn't called."
Participant 3
4.5 / 7
Pickup efficiency (pickup area users)
3 / 3
Interviews cited missed calls
8 / 27
Named pickup as most congested
5 / 27
Signage recalled by participants
02
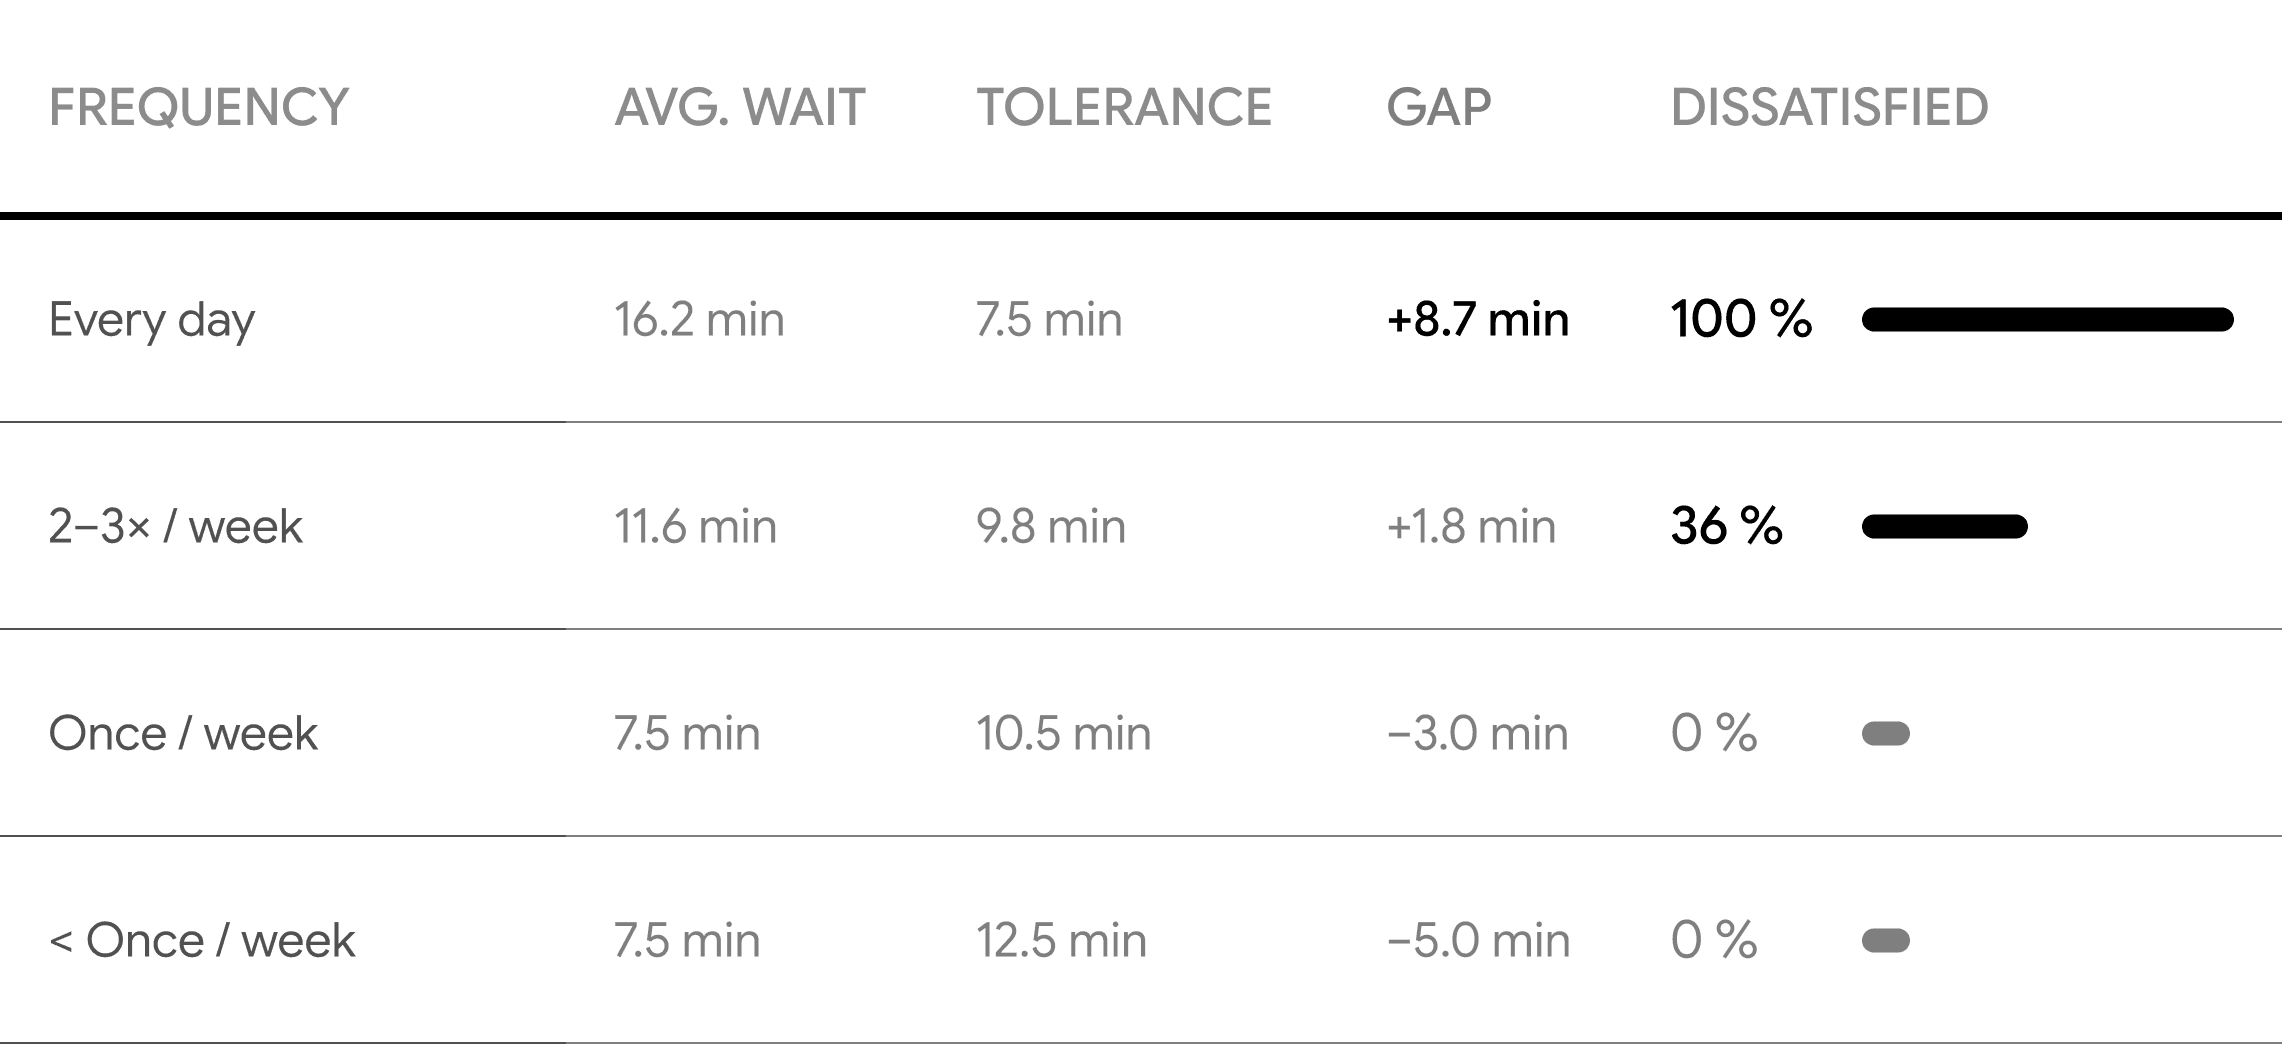
Daily visitors waited the longest and tolerated it the least.
Peak-hour queues stretched past the entrance. Short ordering windows created visible time pressure — students checking phones, shifting weight. Every daily visitor described the wait as their primary frustration.
The survey revealed a gradient no qualitative method could have surfaced: dissatisfaction was not evenly distributed. It dropped sharply from 100% among daily visitors to 0% among those who came once a week or less.
PICK UP FLOW
NOISE ENVIRONMENT
Gap between reported wait and tolerance
"Sometimes it's hard to find mine if I miss the staff member's shout."
Participant 2
"I've skipped lunch entirely because the line was too long."
Participant 3
Pivot finding
Daily visitors reported the lowest satisfaction scores — while infrequent visitors reported almost none.
03
Menu visibility added friction before ordering even began.not preference.
Observation showed a consistent behavior: customers leaning, stepping out of line, or photographing the menu board with their phones. The menu contained a lot of information on electronic screens, but the text was too small to read from the queue.
This created a cascade — undecided customers reached the counter, delayed ordering for everyone behind them, and added time to an already long wait.
Menu readability
Decision latency
01
Arrive in queue → Try to read menu
Customer joins the line and looks up at the menu board. Text is too small from queue distance. Squinting, leaning forward.
Field note 4
02
Workaround → Phone camera zoom
Customer uses phone camera to zoom into the menu signage. Others step out of line to get closer, then rejoin. Some give up and decide at the counter.
Field note 2
03
Reach counter → Still deciding
Some customers only check the menu when they reach the register — adding delay for everyone behind.
Field note 2
04
Result → Frustration
New visitors felt they were holding up the line. This outcome represents lost engagement with the full menu.
Field note 3
"It is just really hard to see the menus for the side because it's very far from the register."
Participant 1
"I always feel like I'm holding up the line while I figure out what to order."
Participant 3
04
Solo diners needed larger tables when lunch overlapped with work.
Menu readability
Decision latency
Initial hypothesis assumed solo diners would prefer small tables. Interviews revealed the opposite: students spread laptops, tablets, and notebooks across their tables, treating lunch as a work session.
When the café was crowded, they felt guilty occupying large tables alone — but still needed the space. When it was quiet, they actively chose 4-person tables for their devices.
Solo diner behavioral pattern
MacBook + iPad + notebook spread across table
Eating while doing homework between classes
Solo but occupying 4-person table
Guilt when crowded
"I usually do assignments or study when I eat lunch. I prefer a dual screen. So I use my MacBook, iPad, and notebook at the same time, so I prefer a big table."
Participant 3
"If I plan to study there, I prefer four seats to just put my stuff on the table, like laptop and books."
Participant 2
"When it is crowded and I'm eating alone, it's kind of feeling guilty to occupy a large table."
Participant 1
8 / 27
Flagged seating capacity
5 / 27
Flagged table spacing
Survey at a glance
Key metrics that supported prioritization across all findings.
Respondents
2.6 / 5
Avg. satisfaction
+2.3 min
Avg. wait gap
4.5 / 7
Pick up efficiency
Improvement priorities
Satisfaction by primary reason
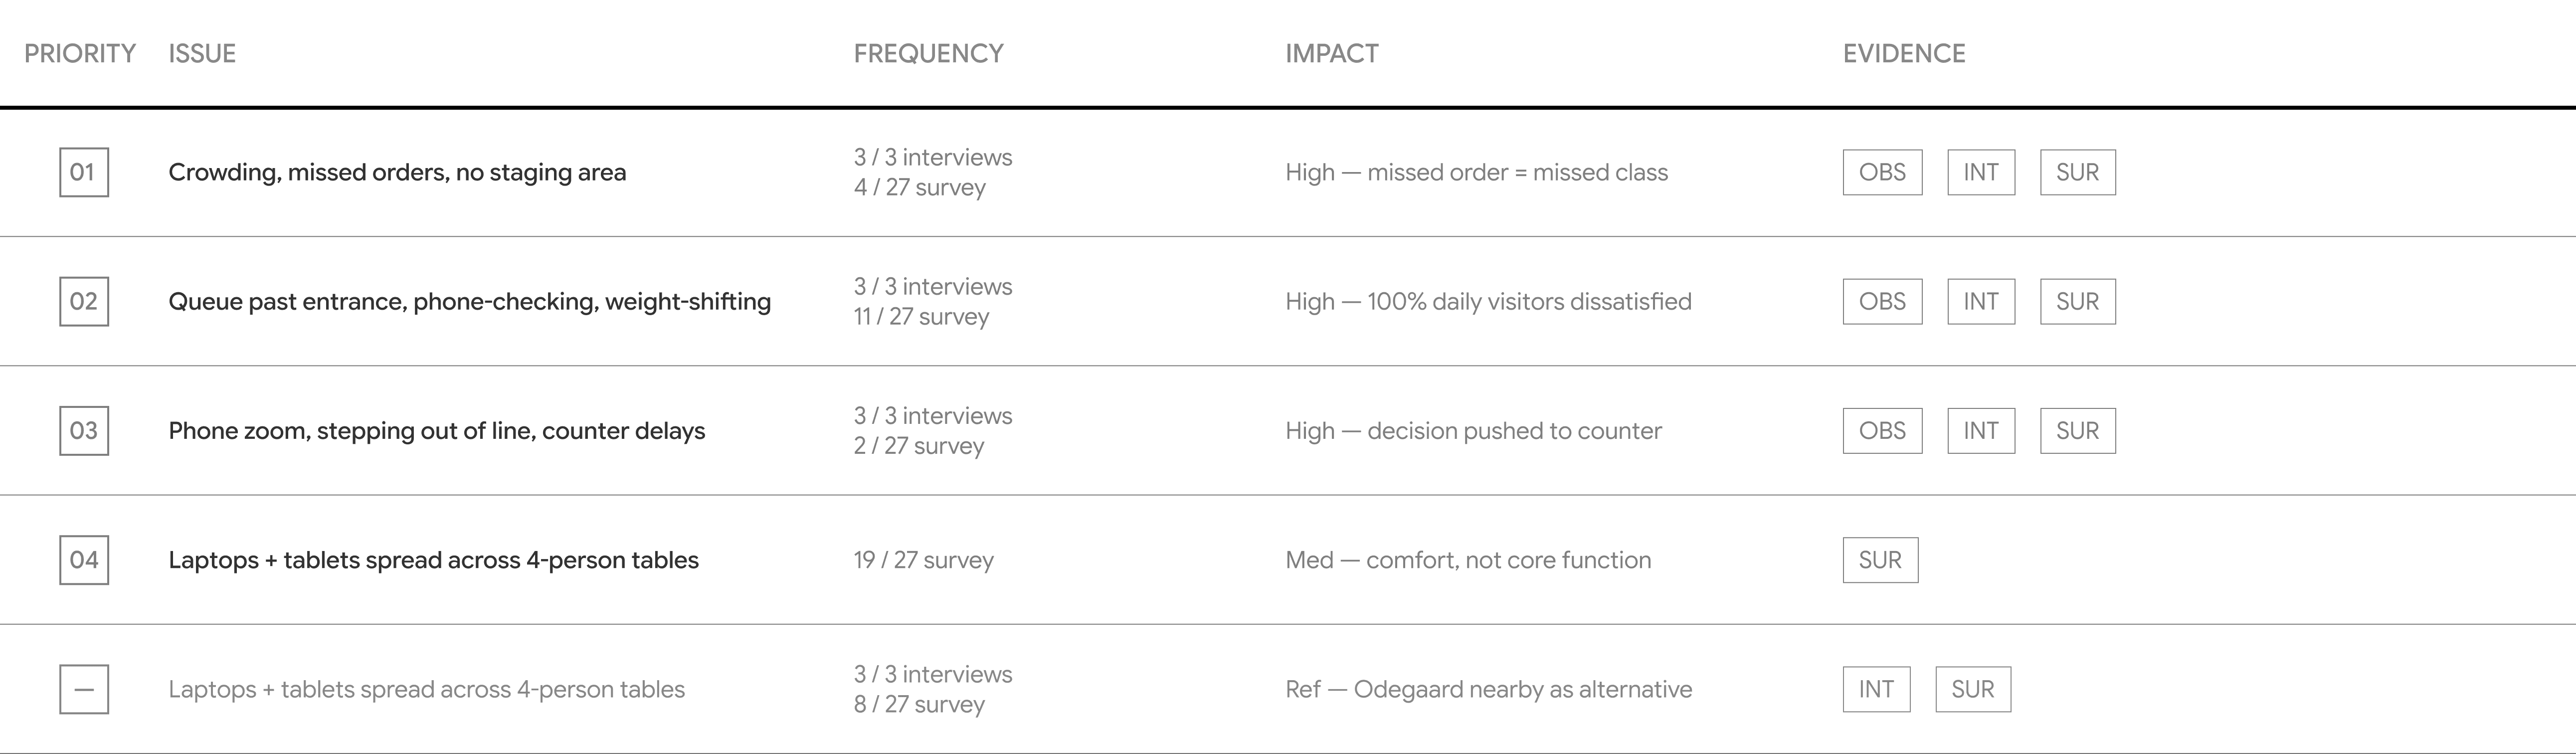
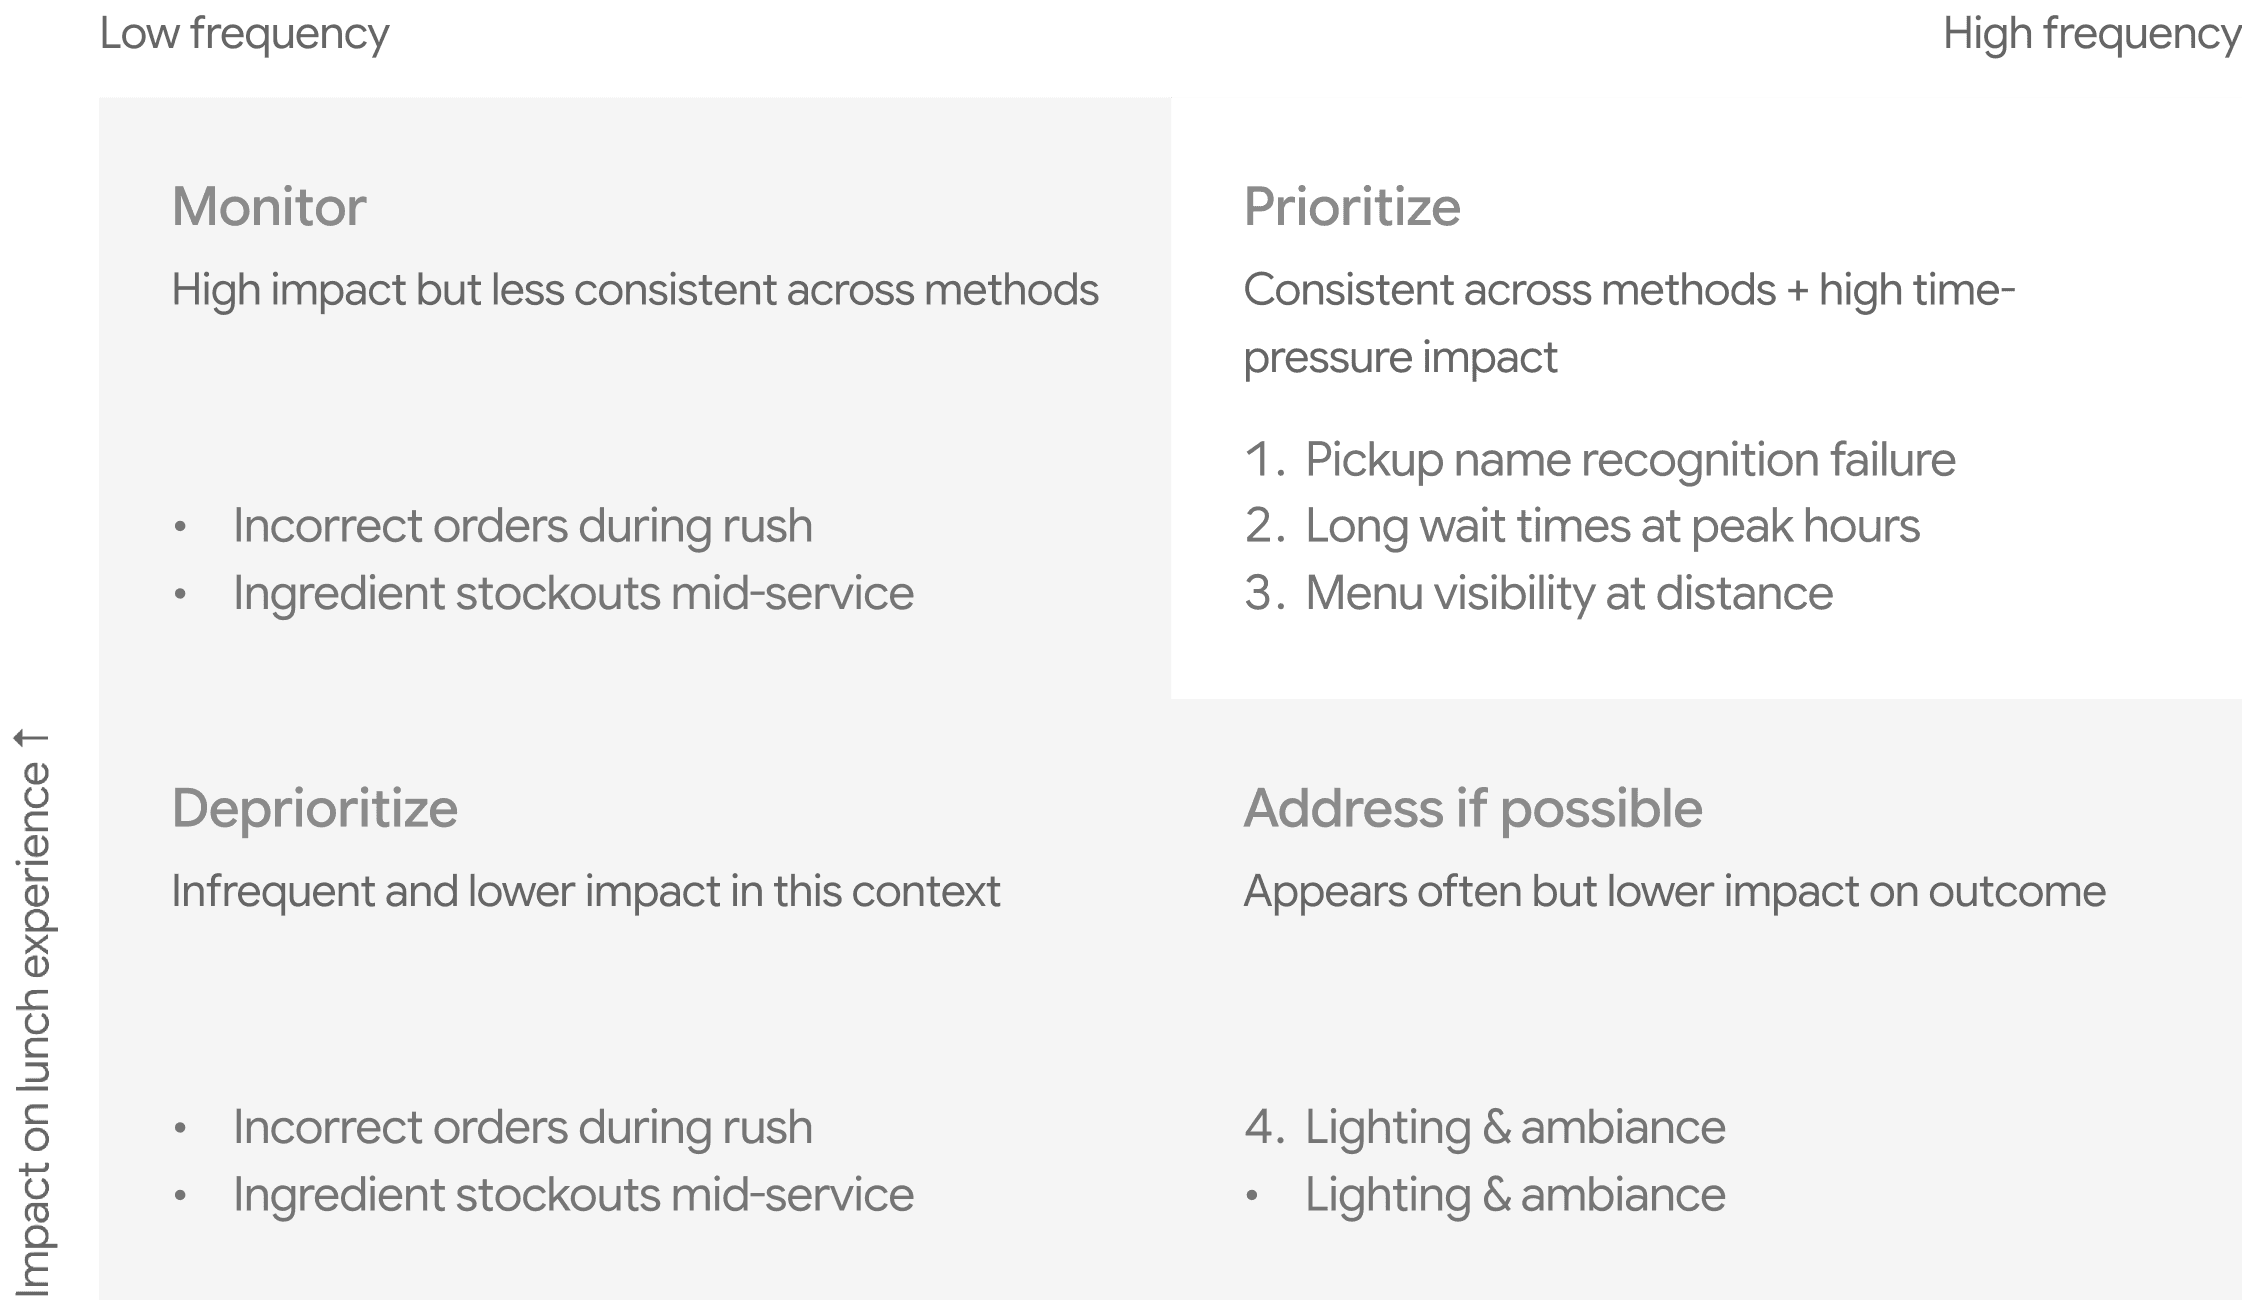
Prioritization
Issues ranked by frequency and impact within the time-constrained context.
Two criteria determined priority: how consistently an issue appeared across all three methods, and how much it amplified friction given the short lunch window.

Limitations
Directional findings, still useful for prioritization.
Analysis focused on recurring patterns, not isolated moments. Single quotes were never treated as proof — cross-method alignment determined confidence.
Study Scope
Observation windows limited to peak lunch hours, single academic term
Interview depth from a small qualitative sample
Survey results relative to participant pool
Findings are directional, not universally generalizable
Why Still Useful
Issues appeared consistently across all three methods
Patterns repeated across multiple participant accounts
Scope sufficient to identify priority friction areas
Strong enough to frame next research directions
Research Value
Observation.
Synthesis.
Prioritization.
The value of this project was not in proposing a finished redesign, but in showing how real behavior, participant perspective, and structured analysis can be brought together into a clear research narrative.
The case study demonstrates research judgment more than polished solutioning — an intentional choice reflecting maturity in understanding the role of UX research within a design process.
Field observation
Thematic coding
Cross-method triangulation
Scope awareness
Prioritization